
General Wellness and Longevity
Blood Test Results Explained: A 2026 Guide to Your Labs

Jake Kaiser
jakesjourney.co

Most advice about blood work is too simplistic. It trains people to look for red flags, glance at a reference range, and move on.
That's not how useful interpretation works.
A lab report is closer to a dashboard than a verdict. A value can sit inside a reference range and still miss the bigger story. A value can sit outside the range and still be less concerning than the trend behind it. MedlinePlus notes that reference ranges are based on healthy populations, and that values inside range don't guarantee good health while values outside range don't automatically indicate disease, which is why the more useful question is often whether a change is meaningful for you compared with your usual pattern, not whether a single result is merely “in range” (MedlinePlus guidance on understanding lab results).
That's the fundamental frame for blood test results explained. Stop reading your labs as isolated pass or fail scores. Start reading them as a personal health narrative built from context, timing, baseline, and repeat testing.
Why Your 'Normal' Blood Test Results Are Not Enough
Reference ranges are population tools, not personal targets
A common mistake is treating the word “normal” as if it means “optimal” or even “fine for me.” It doesn't. Reference ranges are broad screening tools built from populations, not customized performance targets for your body, training load, diet, medications, menstrual cycle, or long-term health goals.
That matters most in the gray zone. Borderline results are where people either overreact or ignore something worth tracking. Both responses are unhelpful. A single lab flag without context is like judging a movie from one frame.
If you want the deeper version of that distinction, Goodlabs has a useful explainer on optimal vs normal blood test ranges.
Practical rule: A result becomes more meaningful when you compare it with your prior baseline, your symptoms, and the conditions under which the test was taken.
What actually makes a result useful
Clinicians rarely make decisions from one isolated number alone when the situation is nuanced. They look for patterns, direction, and fit with the person in front of them.
That's why the popular consumer model falls short. Most pages give a definition, list what high or low might mean, and stop there. What people need is a way to think through questions like these:
Was the test taken under comparable conditions? Fasting, hydration, exercise, alcohol, and medications can change interpretation.
Is this a stable reading or a new shift? A one-off variation often means less than a repeated pattern.
Do related markers support the same story? One number can mislead. A cluster often clarifies.
Does this fit your personal baseline? A small move from your usual pattern can matter more than a generic flag.
This is also where a better testing model helps. Goodlabs is a health platform that gives blood donors free clinical-grade lab panels (run at Quest or Labcorp), and offers the same panels at low cost to anyone who doesn't want to donate. That matters because repeat testing and broader marker access are often what turn a confusing PDF into something actionable.
The thesis is simple. The most useful way to read blood work is not normal versus abnormal. It's pattern versus noise, trend versus snapshot, and personal baseline versus generic range.
Decoding the Core Panels CBC and Lipids
CBC is a pattern, not a score
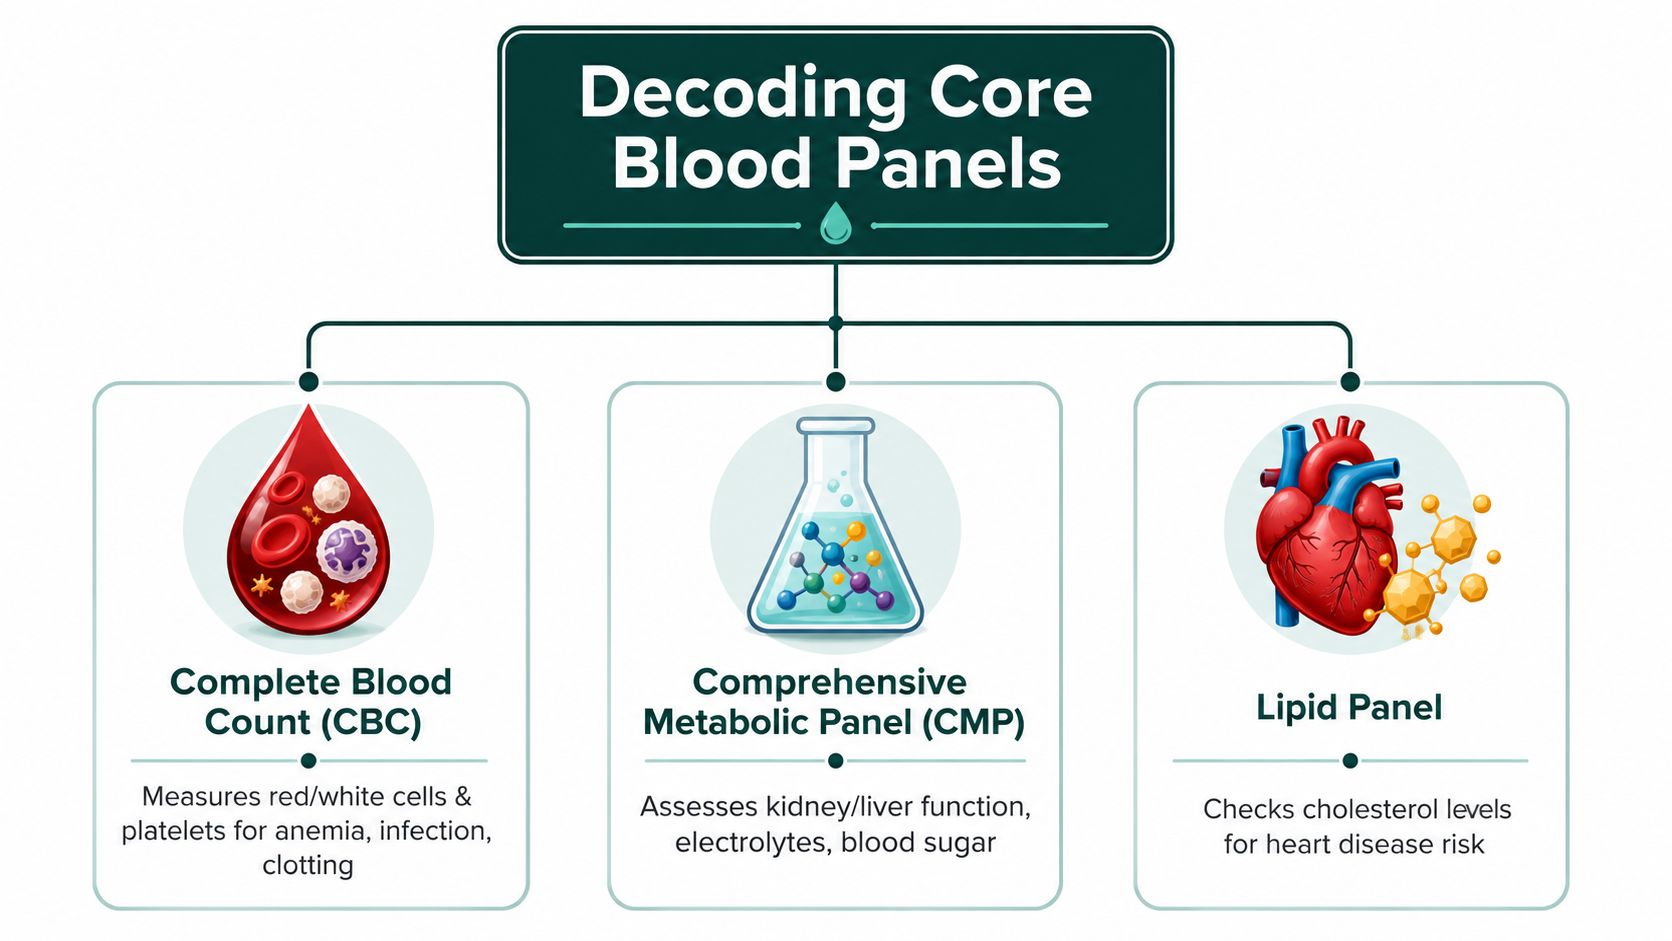
A complete blood count, or CBC, gets misread when people hunt for one headline number. A useful CBC read comes from how the markers line up with each other.
Hemoglobin and hematocrit estimate oxygen-carrying capacity. Red blood cell indices such as MCV and MCH help classify anemia patterns. RDW shows how much red-cell size varies. White blood cells and platelets add context about immune activity and clotting. Common adult reference ranges often cited include WBC 4,000–11,000/µL, platelets 150,000–400,000/µL, hemoglobin 12.3–17.5 g/dL, hematocrit 36%–50%, MCV 80–100 fL, and MCH 27–33 pg/cell (Medical Mutual overview of blood test interpretation).
Red blood cells function like oxygen delivery trucks. Hemoglobin reflects the cargo load. MCV describes vehicle size. RDW shows whether the fleet is uniform or mixed. Looking at hemoglobin alone misses the operating pattern.
That distinction matters in practice. The same hemoglobin can point to different next questions depending on MCV and RDW. Low MCV can fit iron-related patterns. Normal or high MCV shifts the differential in a different direction. If ferritin, symptoms, and prior CBCs tell a different story, the interpretation changes again.
If you want to inspect these relationships directly, a CBC with differential and platelet panel lets you review the full cell pattern instead of a single flagged value.
CMP works best when you group it by function
The full metabolic panel, or CMP, makes more sense when you read it by organ system instead of as a long string of unrelated numbers.
System | What to look for | Why it matters |
|---|---|---|
Kidney-related markers | Filtration and waste-handling markers | These help assess how the body is clearing byproducts and maintaining fluid balance |
Liver-related markers | Markers tied to liver cell stress and protein production | These add context on liver processing, repair, and regulation |
Electrolytes | Sodium, potassium, chloride, and related balance markers | These reflect hydration status, nerve signaling, and muscle function |
Glucose and metabolic context | Blood sugar interpreted with timing and surrounding markers | This gives better context than a glucose value viewed in isolation |
Clinically, this reduces false certainty. A mild shift in one liver enzyme may be less meaningful if neighboring liver markers are stable. A borderline electrolyte result may matter more if it lines up with dehydration, medication use, or symptoms. The panel is most useful when you ask which system is under review and whether nearby markers support the same explanation.
A lipid panel is orientation, not a final answer
A standard lipid panel is helpful. It is also easy to overestimate.
Total cholesterol, LDL-C, HDL-C, and triglycerides give a broad cardiovascular snapshot, but they do not answer every risk question. I often see people treat a normal-looking LDL-C as proof that the whole story is settled. It rarely is. Family history, metabolic health, inflammation, insulin resistance, and particle-related risk can change the picture substantially.
That is why lipid results need interpretation, not just recitation. A panel may look acceptable on paper while the broader risk pattern still deserves a closer look. It may also look worse than expected in a person whose recent diet change, weight loss phase, training load, or fasting status temporarily shifted the numbers.
The practical takeaway from the core panels is straightforward:
CBC helps assess blood cell production, oxygen-carrying capacity, immune activity, and clotting by reading related markers together.
CMP offers a system-based view of kidney function, liver function, electrolytes, and glucose regulation.
Lipid testing gives a starting cardiovascular read, but often leaves unanswered questions about particle burden and deeper risk context.
If a basic panel feels confusing, the usual problem is not that the report failed. The problem is that the report is being read as isolated numbers instead of a connected physiologic story.
Advanced Biomarkers for Proactive Health and Longevity

Standard annual labs are built for broad screening. They're not always built for people who want earlier, sharper insight into long-term risk.
That's where advanced biomarkers become useful. Not because more testing is always better, but because some questions are not well answered by basic panels.
What advanced markers add
A few categories matter more than most for proactive tracking:
ApoB measures the number of atherogenic lipoprotein particles. In plain English, it's closer to a particle count than a cholesterol weight estimate.
Lp(a) is a genetically influenced lipoprotein marker that can add cardiovascular context not visible on a standard lipid panel.
hs-CRP means high-sensitivity C-reactive protein. It's used as an inflammation marker and can add context when you're trying to understand low-grade inflammatory burden.
Ferritin helps assess iron storage. It can change how you interpret fatigue, recovery, or CBC findings.
Vitamin D offers nutrient status context that basic chemistry panels usually don't provide.
What makes these markers valuable isn't novelty. It's that they answer different questions.
A standard lipid panel may suggest the outline of a heart health story. ApoB and Lp(a) can refine that story. A CBC may hint that iron-related issues belong on the differential. Ferritin can help connect the dots. A general wellness picture can feel vague until inflammation markers like hs-CRP sharpen the signal.
Where these markers become practical
Recent research also supports a more personalized approach to interpretation. Differences in average hemoglobin, MCV, CRP, and albumin have been observed across ethnic groups, which can affect how reference ranges are applied in primary care and reinforce why one-size-fits-all cutoffs are often incomplete (research on ethnic differences in biomarkers and reference range interpretation).
That's part of why advanced markers are becoming more relevant. They fit a model of care that's less about a yearly snapshot and more about layered context.
For a deeper look at that style of testing, this guide to blood tests for longevity is a practical next read.
One useful way to think about it is simple. Basic panels tell you whether the lights are on. Advanced markers help you inspect wiring that may matter long before the room goes dark.
A short walkthrough can help if you're deciding which markers deserve a place in your routine:
How to Read Your Results for Meaningful Insights
Control the noise before you interpret the signal
The most common reading error happens before anyone opens the report. It starts with test conditions.
Pre-analytic factors can materially change interpretation. Some blood tests, including glucose and cholesterol, commonly require fasting for about 8–12 hours, and guidance also emphasizes disclosing recent illness, regular medications, alcohol, tobacco use, and strenuous exercise because they can shift values independent of underlying disease (Forbury Clinic explanation of blood test preparation and interpretation).
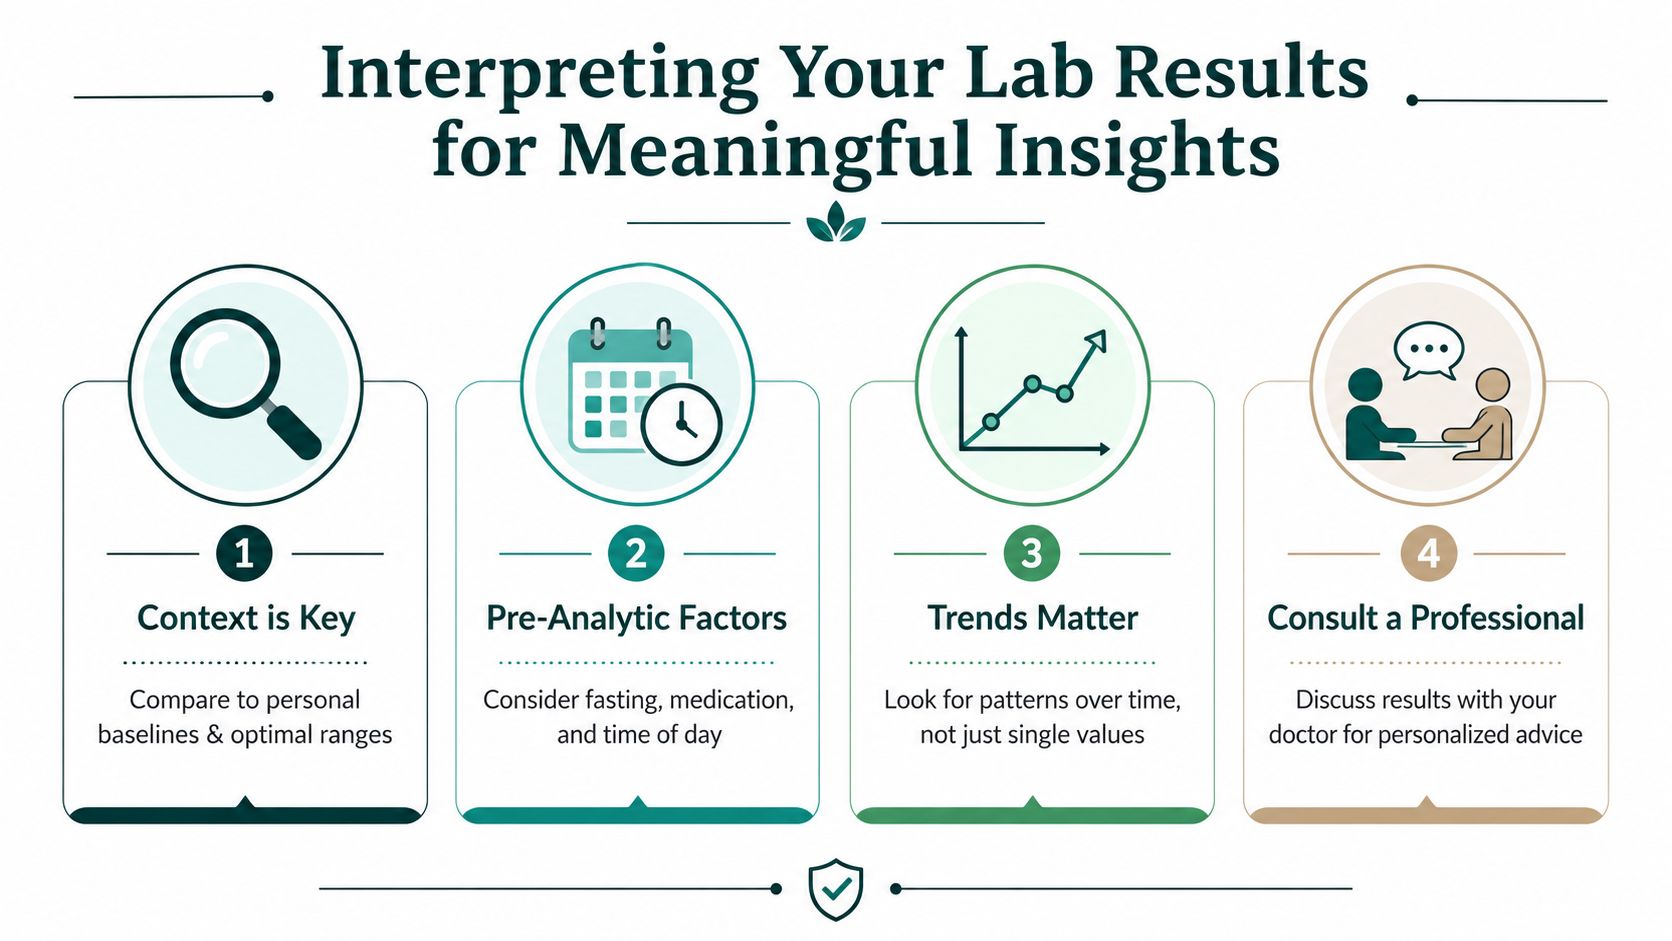
If you compare one fasting draw after a calm week with another taken after hard training, poor sleep, and a minor illness, you're not comparing like with like. You're mixing physiology with noise.
A practical checklist before interpretation:
Match test conditions when you can. Similar fasting status, time of day, and hydration make comparisons cleaner.
Log temporary disruptors such as illness, hard workouts, travel, or alcohol.
Review medications and supplements because they can move results in ways that have nothing to do with disease progression.
Treat one-off anomalies cautiously unless they fit symptoms, repeat on retesting, or align with related markers.
Blood tests are snapshots. Useful interpretation comes from understanding what was happening when the photo was taken.
Use trend lines and personal baselines
That's where smarter reading begins: ask whether the result changed in a way that matters for you.
That matters for glucose markers too. Fasting glucose gives a current snapshot, while A1C reflects average blood sugar over the prior 2–3 months. When those two don't line up neatly, the answer isn't automatically lab error. It may reflect short-term perturbations, altered red-cell turnover, or changing control, which is why trends and context matter more than a single out-of-range value, as discussed in the same Forbury Clinic guidance.
Personalization also matters across populations. Reference ranges vary, and people don't all start from the same biological baseline. That doesn't mean ranges are useless. It means they're incomplete without your history.
For people who want to build that history, regular measurement is usually more informative than sporadic testing. This article on the benefits of regular blood testing gives a practical framework for that habit.
The useful mindset is this: don't ask only, “Is it flagged?” Also ask, “Is it different, repeatable, and consistent with the rest of the picture?”
Turn Your Lab Data Into Action with Goodlabs
Reading labs well is one skill. Turning them into a repeatable decision process is another.
Individuals often get stuck in one of two bad loops. They either ignore results because the PDF is too technical, or they over-interpret one borderline value and start changing everything at once. Neither approach works well. What works is a simple cycle: organize your results, compare them over time, identify which shifts are likely meaningful, and then make targeted follow-ups.
What helps and what usually doesn't

A practical tool should make four things easier:
Useful feature | Why it matters in real life |
|---|---|
Clear result display | You can scan patterns across markers instead of hunting through a dense lab PDF |
Longitudinal tracking | Trends become visible, which is often more informative than a single report |
Marker explanations | Plain-language interpretation helps you decide what deserves attention |
Historical lab imports | Older results create baseline context from day one instead of forcing you to start from zero |
That's the lens to use when evaluating any lab-tracking option.
A practical workflow for acting on results
Goodlabs fits that model in a fairly direct way. It lets users book testing through Goodlabs test booking, receive secure digital results, review explanations, track trends over time, and upload prior lab work from other providers to build a more complete baseline. For people trying to move from occasional testing to ongoing pattern recognition, those functions solve a real friction point.
The next step is still behavior, not just data collection. If your markers point toward blood sugar concerns, for example, a structured nutrition resource can be useful. This guide to healthy eating for diabetics is one example of a practical starting point for meal planning conversations and self-management habits.
Decision filter: Don't change five variables after one lab report. Pick the most plausible driver, retest under similar conditions, and see whether the pattern moves.
That's the key. When you can see your labs as a timeline instead of a stack of disconnected reports, you stop being a passive recipient of numbers and start acting like the owner of your health data.
FAQs About Blood Test Results
Question | Answer |
|---|---|
What's the first thing I should look at on a blood test report? | Look for patterns, not one flagged value. Compare related markers, your prior results, and the conditions under which the test was taken. |
Can blood test results be abnormal and still not mean disease? | Yes. Reference ranges are population-based, so an out-of-range value doesn't automatically indicate disease and may need context or repeat testing. |
Should I worry if one result is slightly high or low? | Usually not in isolation. A borderline value is more useful when you know whether it's new, repeatable, and supported by related markers or symptoms. |
Do I need to fast before every blood test? | No. Some tests like glucose and cholesterol commonly require fasting, while others may not. Follow the instructions for your specific panel. |
Why do my results look different from last time? | Testing conditions can change results. Fasting status, hydration, exercise, illness, alcohol, and medications can all shift interpretation. |
The best use of blood work isn't reassurance from a green flag or panic from a red one. It's learning how your markers behave over time, under real-world conditions, and in relation to each other. That's what turns lab testing into a proactive health tool.
Blood test results are informational and not a medical diagnosis. Talk to your physician about what your results mean for you.
If you want a simpler way to organize, track, and revisit your biomarkers over time, explore Goodlabs.
Jake Kaiser
jakesjourney.co